
The Chart
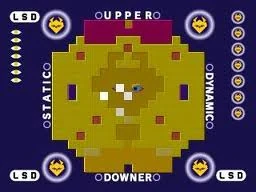

The Chart after 4 days, showing previous gradings in gradually fading luminance
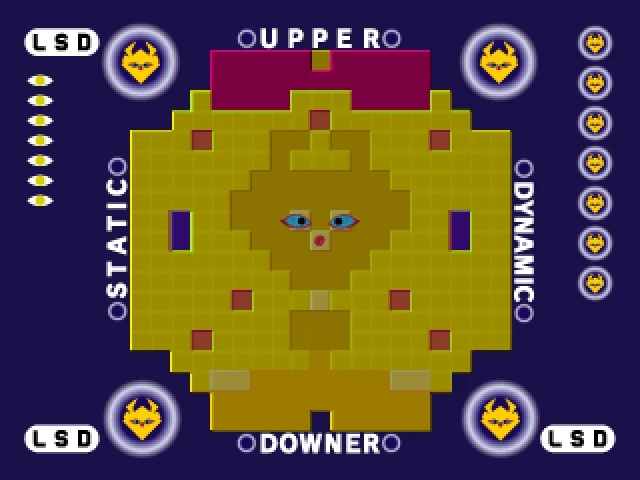
The Chart (or "Graph" internally) is a 19x19 grid displayed at the end of every day in LSD: Dream Emulator. It can also be accessed from the main menu of the game.
Appearance[]
The Chart appears as a square with the pixelated corners taken out, colored in various shades of yellow and red. In the center of the graph is Linen, assuming its square-like form. There are four marked sides, Static, Dynamic, Upper, and Downer. Small circles containing Linen in rhombus form are nestled in the corners.
Description[]
After a dream comes to an end, the chart slowly fades in, and a rapidly flashing red square (the Chart's marker) denotes the rating of said dream (the main character's mood). At the same time, it indicates the spawn location for the following dream (see complete map of spawning locations in the gallery below).
As the player continues to complete more and more dreams, cells that have been rated previously remain as filled white cells, which get slowly darker as the days go on. The brightness of each filled cell indicates how well the main character remembers their corresponding dream, which also affects the order of dreams in the Flashback option (if the option has been unlocked in the Main Menu of the game before). One filled cell is stored on the chart for 100 days, slowly becoming darker and eventually disappearing completely.
The usage[]
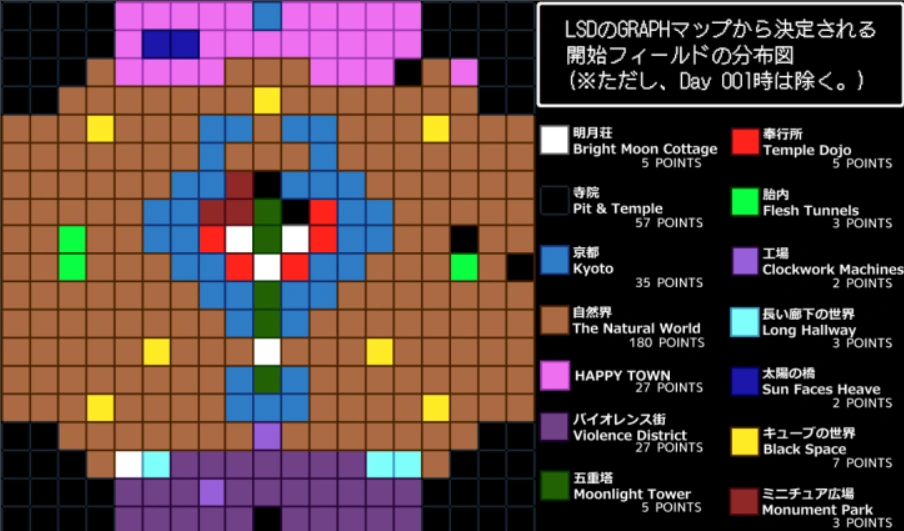

The complete chart of existing spawn locations. Picture by Higashi.
After each dream the chart's marker indicates dream's influence on the main character's mood and also shows the spawning location for the following dream. Making your dream cheerful by spending time in Happy Town and observing harmless/friendly objects makes the chart's marker go up and rises the chance to begin the next dream in a Happy Town again: the magenta colored zone on the chart's top is responsible for Happy Town spawns (see picture provided).
When doing same actions in the Violence District or other disturbing places, the marker is then more likely to fall to the bottom of the chart, rising the chances to begin the following dream in the Violence District.
Static & Dynamic chart sides are more complicated to explain. The Dynamic side of the chart is said to contain rare events in it, while the Static side dreams may cause repetitive cycle of dynamic links between certain locations; but the actual characteristical difference between "static" and "dynamic" dream still remains unknown: overall features of both these dreams seem to be similar or even identical. The only currently known difference, is that static side of the background chart has no activator cells for the rare events in the game, however this doesn't mean that in "static"-rated dreams the rare events are impossible to encounter: the marker of the background chart can be successfully moved towards the "dynamic" side anytime (more information below).
Basic mechanics[]
The chart itself has an x and y coordinate mechanic, where Linen's nose is considered to be cell (0,0). A cell 3 steps to left and 2 steps up from Linen's nose, for example then, is (-3,2).
There are 361 possible cells to fill (including 52 invisible cells, which are located outside the visible boundaries of the chart, in it's empty corners) in total; however it is known to be impossible to fully fill the whole chart with rated dreams: the memory of past dreams never last for more than 100 days.
The Instruction Booklet for the game states that "the places you have visited and the things you saw determine the point on the graph." Looking at things and objects causes events which individually shift the chart's marker. As the player visits locations and interacts with objects, events stack over each other, shifting the ending coordinates around and giving the chart its seemingly unpredictable nature.
Research Information[]


The background chart with all possible link zones labeled. Picture by Higashi.
While the dream session runs, the chart continues to work in the background. While it is invisible to the player, it still functions and stores all the actions the player takes.
The background chart is responsible for the link colors and for activation of different rare events during the dream. Certain objects have certain " mood influence values " applied to them, which shift the chart's marker (the red blinking square which is seen on the final chart after the dream's end) towards certain " link zone " on the chart which these values correspond to. There are 8 different link zones existing on the chart, so that there are 8 link colors possible to encounter in-game: green, blue, pink, white, black, yellow, red & cyan.
When the chart's marker enters the certain " link zone ", the link recieves the color of this zone (see picture provided). For example, when the chart's marker is on the " blue link zone " of the chart, while the dream session is still running, the linking process becomes followed by the blue link. Each event causes the marker to move through the chart and enter different colored zones of the chart, while the dream continues. This is basically how the linking color is working.
It is also notable, that ending a dream while the marker is at certain link zone has a high chance of causing the final marker to be located within this link zone. The exact cell of the zone will be selected based on other factors this dream and previous dreams had; even though in most cases, the resulting chart is identical to the final state of the background chart, sometimes the final calculation of the dream rating shifts the marker out of the expected link zone.
It is usually more difficult to achieve drastically Static or Dynamic dreams, but certain actions may " push " the marker way too far from the center, resulting in marker teleporting to the opposite side of the chart, sometimes entering zones, which are responsible for causing different rare events.
As an example, the Astronaut's landing in the Bright Moon Cottage is known to usually happen after a contact with the Gray Man & a pink link. It seems illogical at first, as pink zone of the chart should represent highly upper and dynamic dream, and the Gray Man shouldn't be considered a positive experience of course. The fact is, that the Gray Man indeed has the most negative influence on the main character's mood (-10; -10) among all the existing objects, but the chart is often unable to place the marker that low and static-wise because of the chart's size limit. As a result, when the marker reaches any edge of the chart and it still needs to move further, it is force teleported to the opposite side of the chart.
This is why the Gray Man's trigger seem to cause the pink link commonly: the marker teleports from the lower left corner of the chart (the yellow zone) to the upper right corner (the pink zone), which cells are known to activate numerous rare events, including the Astronaut Landing event. If the following dynamic link sends the player to the Bright Moon Cottage on any B-type dream during the player's first visit to the Bright Moon Cottage on given dream and it's color is pink - the needed conditions are reached - the Astronaut lands. You can learn more about this topic on the Giant Astronaut page.
After almost 26 years of LSD: Dream Emulator existence the true mechanics of the final graph result were finally understood and calculated. The hacking tool called " Lucid Dream Explorer " has been created to watch the current " last event return value " and to edit other important dream features. Other important mechanics were descripted on Data Analysis & Generation pages in detail.
Still, more research work is needed to give more information about manipulation with variables from the memory edit table. All needed mathematical formules have yet to be put on Data Analysis page and be properly explained to the community. The work on this topic still continues to this day.
Trivia[]
- If the eyes, nose, and the cell three beneath the nose (0,-3) are covered, all four cells will flash green and the game will proceed to show a long playlist of Video Dreams which will be impossible to skip. This video dream compilation will start automatically and end when the compilation finishes.
- The image file that contains the graph is called "HGRAPH.TIM", under the ETC file directory.
- There is a rare chance that a previous/next dream will be recorded outside the chart's visible boundaries, on the invisible cells. This will result in a Pit & Temple spawn and is more likely to happen if the player falls very often.
Gallery[]
")
")
")
")
")
")
")
")